
Your Biggest Daytime Load and Your Solar Peak Happen at the Same Hour.
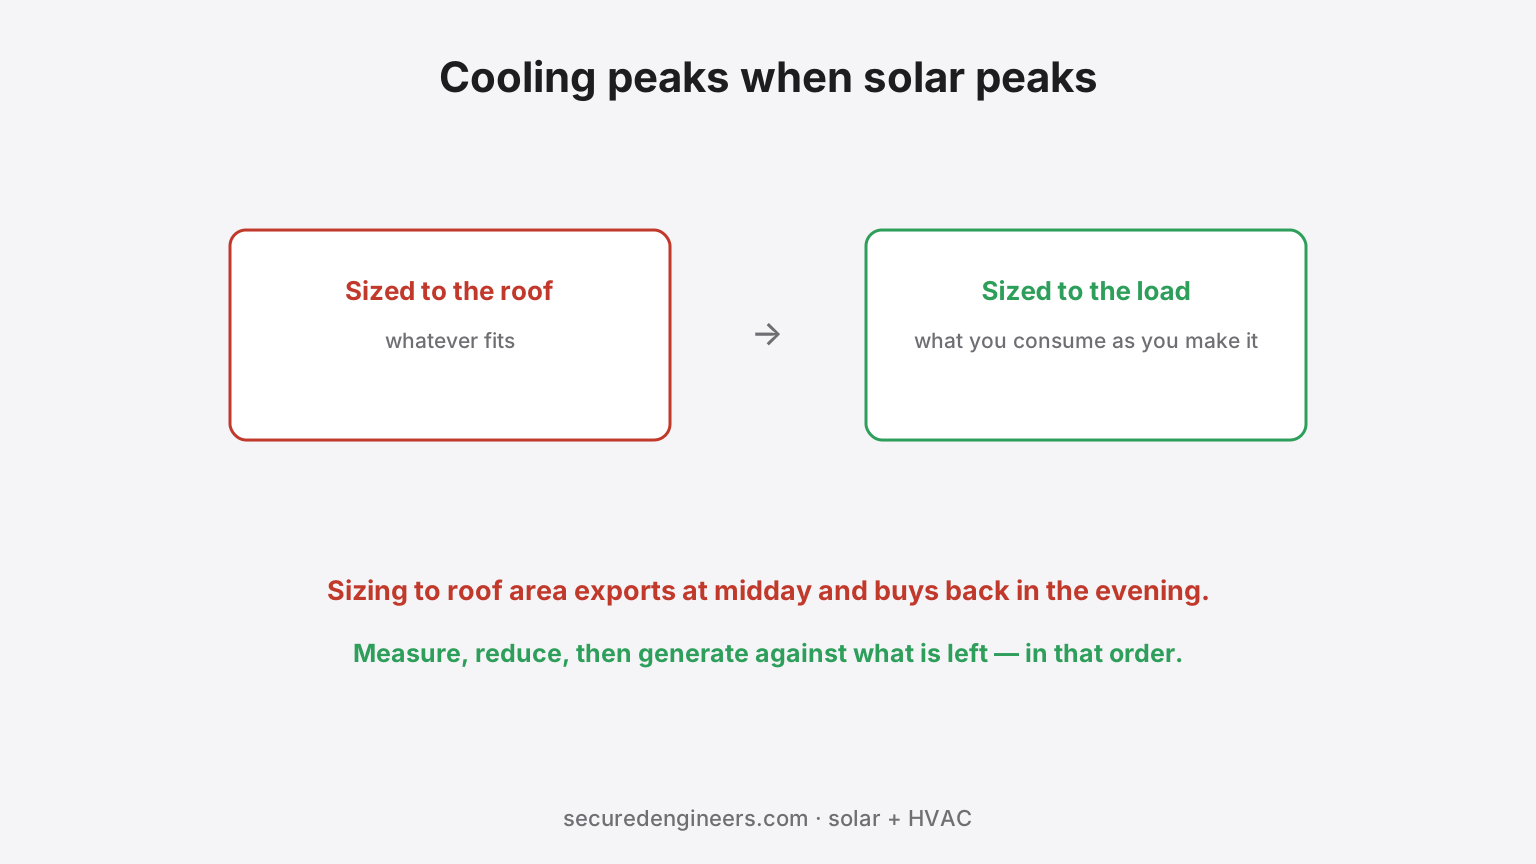
On most air-conditioned buildings in India, cooling is the largest single electrical load, and it peaks in the afternoon of the hottest days. Rooftop solar peaks in the same hours. That coincidence is the strongest technical argument for putting the two together — and it is routinely wasted by sizing the array to the roof rather than to the load.
Why the coincidence matters more than the annual total
Annual generation is the figure everyone quotes, and it is the less useful one. What determines the financial return is how much of that generation offsets consumption at the moment it is produced, because self-consumed units are worth your full tariff while exported units are worth whatever the net-metering arrangement pays — usually less.
A building whose load profile matches the generation profile self-consumes most of its output. One whose demand is concentrated at night exports at midday and buys back in the evening, at a worse rate in both directions.
| Building | Match |
|---|---|
| Office / commercial, daytime occupancy | Strong — cooling and generation coincide closely |
| Single-shift factory with air conditioning | Strong through the shift |
| Hotel | Moderate — peaks morning and evening, dips midday |
| Cold storage | Strong and continuous, though night load remains |
| Two/three-shift plant | Partial — solar covers one shift; the rest is where storage earns |
How to size against the load rather than the roof
Start from an interval consumption profile, not a monthly bill. A monthly kWh figure cannot show you what happens at 2pm in May, which is the whole question. Most industrial connections can provide interval data; where they cannot, logging for a representative period is worth the delay.
Then compare the generation curve against the load curve, hour by hour, and size to the point where additional capacity starts exporting rather than offsetting — unless your net-metering arrangement makes export genuinely worthwhile, in which case size larger deliberately and with that arrangement confirmed.
The efficiency measure that comes first
An uncomfortable point worth stating: on many buildings, reducing the cooling load is cheaper per unit saved than generating to serve it. Correcting duct leakage, balancing air distribution, fixing a poorly-controlled plant, or reducing solar gain will often cost less than the array needed to power the waste — and it shrinks the array you then need.
The right sequence is measure, reduce, then generate against what remains. Related: duct leakage and the performance gap and glazing and cooling load.
What we do differently
Because we deliver both, we size the array against a measured cooling profile rather than against roof area — and will tell you when fixing the HVAC is the cheaper unit before quoting Solar EPC. Start with the solar calculator for an independent baseline.
More insights
Your Factory Has a Reservoir, an ETP Pond, or a Cooling Tank. That's Roof Area You Haven't Counted.
Floating solar puts panels on water instead of roof or ground — a genuine option for factories, textile mills and campuses that already have a reservoir, effluent pond or cooling water body. It isn't free capacity, though: anchoring, water quality and access all add real engineering that a roof-mount quote doesn't have to price.
Solar EnergyYour Quote Says TOPCon Now, Not PERC. Here's What Actually Changed.
Most commercial and industrial solar quotes in 2026 default to TOPCon modules rather than the PERC panels standard a few years ago. The efficiency number moved, but the number that matters more for a 25-year asset is the degradation curve — and that's where N-type genuinely earns the switch.