
Your Solar ROI Model Assumed Average Sun. December in Punjab Isn't Average.
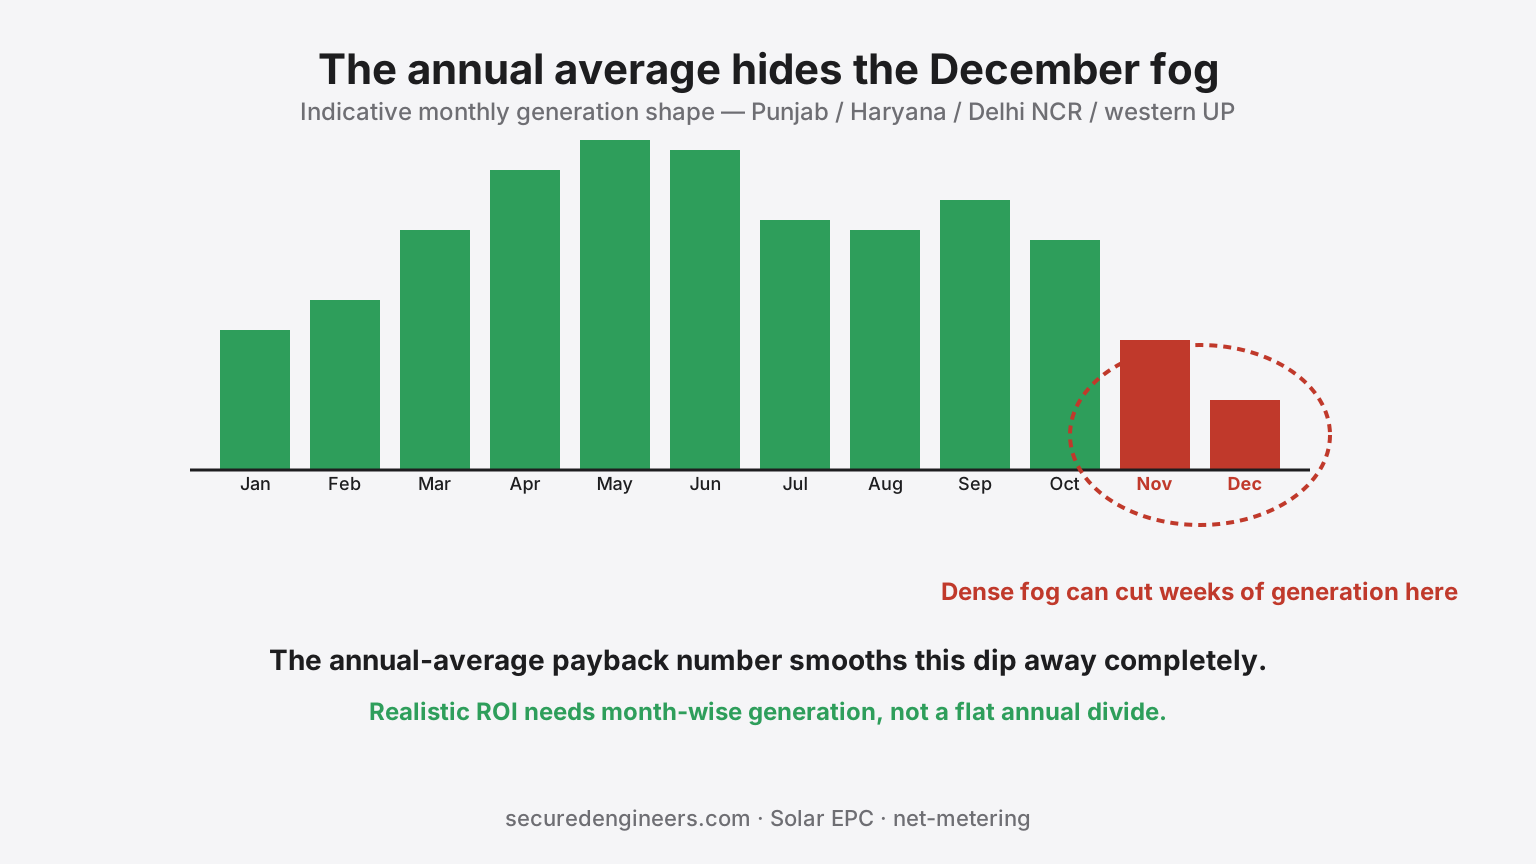
Every solar payback pitch leads with an annual number — kWh/kWp/year, averaged across 365 days. It's the right number for comparing systems. It's the wrong number for setting expectations about any specific month, and the month it misleads on hardest is exactly the one where North Indian industrial buyers usually first notice: December and January, when dense fog blankets Punjab, Haryana, Delhi NCR and western UP for stretches of days to weeks at a time.
Why fog is a bigger hit than "cloudy days"
Cloud cover reduces solar irradiance but panels still generate meaningfully through it. Dense fog is different — it can persist for days at a stretch through late-morning hours in the worst weeks of the season, cutting direct irradiance far more severely than typical monsoon cloud cover does, and it's a well-documented, recurring feature of the North Indian winter, not an occasional anomaly.
An annual-average payback model smooths this out entirely — the shortfall in December/January is mathematically offset by strong generation in April–June, and the annual total can look perfectly on-target even though two consecutive months underperformed by a wide margin against the flat monthly assumption a buyer may have implicitly made.
What this means practically
- For DG-offset calculations — if the pitch was "solar replaces X hours of DG running daily," that offset shrinks precisely during the weeks fog is worst, which is worth knowing before, not after, sizing a hybrid solar-DG-grid setup. Our DG running cost & solar ROI calculator is built to model this alongside grid tariffs, not solar alone.
- For net-metering export expectations — a facility relying on winter export credits to offset summer import should model the real seasonal curve, not divide the annual figure by twelve.
- For payback-period commitments — a payback quoted purely off the annual average is directionally correct but will always look "behind schedule" every winter, which is a communication problem worth heading off with month-wise numbers up front.
The honest fix: model the year, not the average
A realistic rooftop solar proposal for a Punjab, Haryana, Delhi NCR or western UP site should show month-wise generation, not just the annual total — using historical irradiance data that accounts for the region's known winter fog pattern rather than a flat monthly division. It doesn't change whether solar makes sense (it almost always still does, on the annual number) — it changes whether the buyer's expectations match reality every single month, which is what actually determines whether a system is judged a success three years in.
See our broader payback analysis in rooftop solar payback in India, and get a month-wise estimate — not just an annual one — through our Solar EPC team.
More insights
Skip the Subsidy, Skip the Rules? PM Surya Ghar's Module Exemption, Explained.
MNRE's recent clarification lets PM Surya Ghar applicants who voluntarily forgo the subsidy use non-DCR solar modules, with some residential consumers also getting exemptions from ALMM List-II requirements. That sounds like more freedom — and for the right buyer, it is. For most homeowners, it's a trade-off between a smaller upfront cost and a set of protections the subsidy scheme was built to guarantee.
SolarThe Solar Quote Looked Great. Nobody Checked If Your Roof Can Carry It.
A rooftop solar quote is easy to compare on ₹/kW. What it often skips is whether the existing roof structure — designed decades before solar existed — can actually carry the panel dead load plus wind uplift. Find out before the array is on the roof, not after a monsoon storm.